A good report isn’t written in deadline week. It is built every day.
Donor reporting: from Excel to dashboards
Many coordinators dread reporting week: gathering figures from different projects, matching spending to activities, then discovering the numbers don’t add up. The fix is not a nicer report template but organised data from the start.
NGOs and charities 6 min read
By Nour Aldein Tleti. Updated .

How can an NGO improve donor reporting with dashboards?
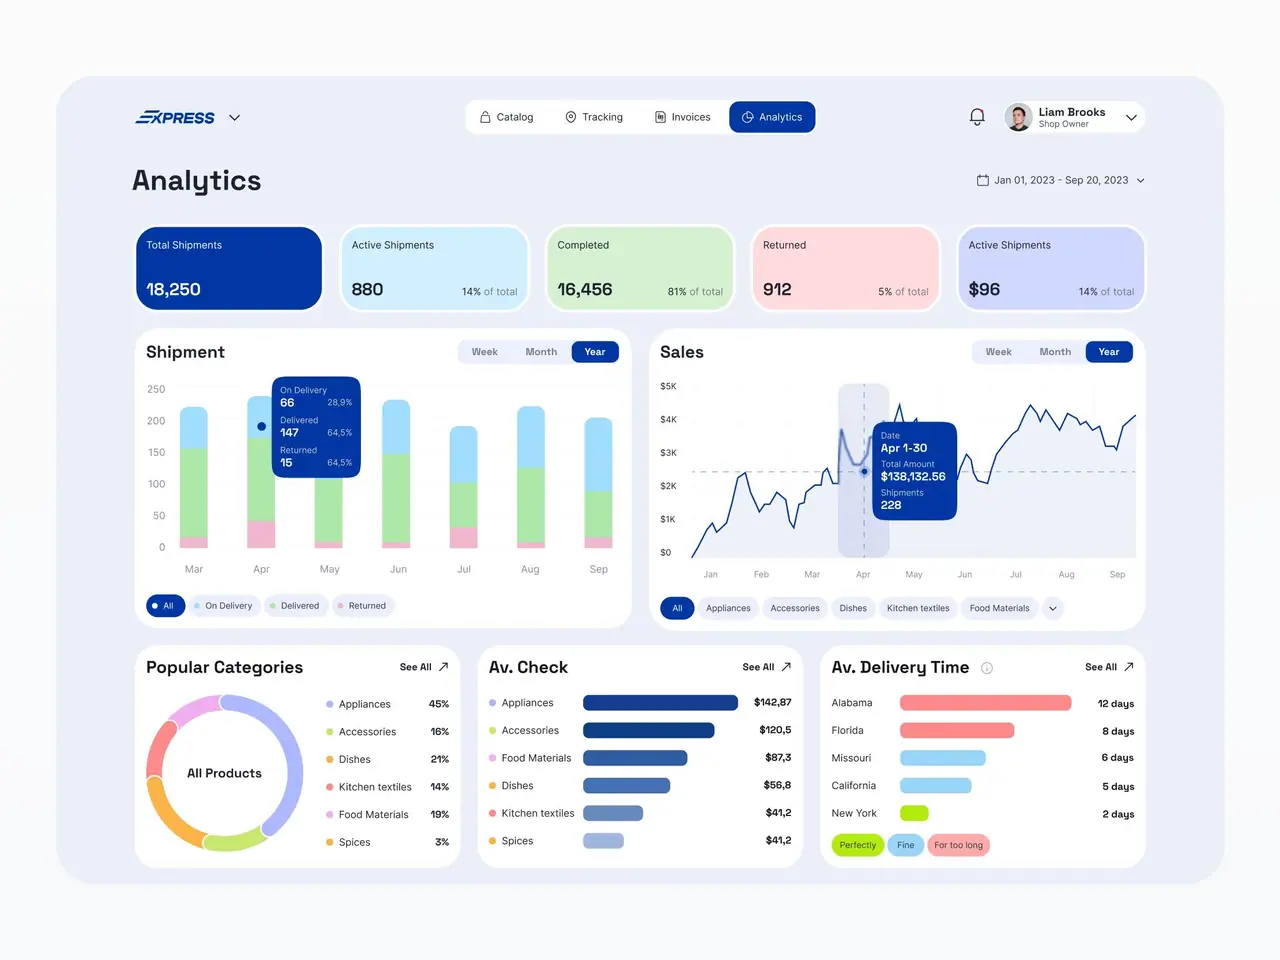
Link each grant’s indicators to the data you collect every day, and bring activities, beneficiaries and spending into a single source. The dashboard then becomes a live view of that data, and the report becomes an export from it plus a written explanation. Errors drop, and the donor can trace every figure back to its source.
Why Excel reports wear the team out
- Many files, many copies
- Each project has its own file and each staff member their own copy, so nobody knows which version is the official one.
- Inconsistent definitions
- A “beneficiary” may mean an individual in one project and a household in another, so the totals can’t be compared.
- Programmes separated from finance
- Activity figures sit in one department and spending in another, and they are reconciled by hand at the last minute.
- Hard to prove a figure
- When a donor asks where a number came from, the team spends a long time searching papers and photos for the evidence.
What a good dashboard needs
- A clear indicator framework
- Turn the grant’s indicators into written definitions: what is counted, from which source, and how often it is updated.
- One data source
- Have the dashboard read directly from the unified register and the finance system, not from files copied by hand.
- Useful breakdowns
- Show figures by project, area, group and period, according to what the donor asks for and what management needs.
- Attached evidence
- Link each activity to attendance or distribution lists or documented photos, so verification is easy without exposing sensitive data.
- One dashboard for management, another for the donor
- Management needs operational detail and the donor needs the grant indicators, so don’t mix them on one screen.
Common dashboard mistakes
- Lots of indicators, no decisions
- A dashboard showing dozens of numbers helps nobody, so choose the indicators that real decisions are based on.
- Figures with no update date
- If readers don’t know when the numbers were last updated, they won’t trust them or use them in a report.
- Personal data on display
- A dashboard meant for a donor or the public shows aggregate figures only, never names or family details.
- A dashboard with no owner
- Assign someone to be responsible for the accuracy and follow-up of each indicator, or the dashboard goes stale and the team drifts back to manual files.
A gradual transition plan
- 01
Collect donor requirements
Lay the report templates and required indicators side by side, and identify what they have in common.
- 02
Standardise definitions
Write one definition for each indicator and apply it to every project without exception.
- 03
Organise the data source
Make sure the register, activities and finance are entered in an organised way using the same project codes.
- 04
Build the first dashboard
Start with a dashboard for one grant and a limited number of indicators, and review it with the programme team.
- 05
Compare with the manual report
Produce one report both ways and compare the results, then fix the source of any difference.
- 06
Adopt it officially
Once verified, make the dashboard the source of periodic reports, and keep the manual method only as a temporary reference.
A quick comparison
| Aspect | Manual Excel reports | Dashboards |
|---|---|---|
| Preparation time | Days before each deadline | Continuous updates and export when needed |
| Accuracy | Depends on manual copying | Depends on the quality of entry at the source |
| Traceability | Hard to get back to the source | Every figure linked to its records |
| Management oversight | A late picture at the end of the period | A near-live picture during implementation |
Read also
Frequently asked questions
Do we need expensive software for dashboards?
Not always. There are reporting tools within office suites such as Microsoft 365 and Google Workspace, and standalone analytics tools with different options. What matters is that the data is organised before you choose a tool.
How do we show spending in two currencies?
Record each transaction in its original currency with the exchange rate used on the day, then show the total in the grant currency according to the rule agreed with the donor.
Can we share the dashboard directly with the donor?
Yes, if it shows no personal data and access is read-only. Many organisations prefer to send a periodic exported copy instead.
What if field data arrives late because of connectivity?
Show the last update date clearly on the dashboard, and set a fixed sync schedule so everyone knows how current the figures are.
Can we get help designing dashboards?
Yes. The ONE DIGITAL team can review your indicators and data sources and suggest a dashboard that fits the size of your organisation.
Keep exploring
- Digital transformation for NGOs and charities in SyriaDonors want evidence, beneficiaries deserve dignity, and your team wants fewer spreadsheets.
- Business intelligence and management dashboards in SyriaA manager who waits for reports manages last month’s business.
- From Excel to an integrated system: ERP or CRM first?Excel is a great tool. It is a terrible company system.
- Data and artificial intelligence for Syrian organisationsAI is only as useful as the data and rules behind it.
Need help with your organisation’s digital transformation?
Message ONE DIGITAL’s Syria branch on WhatsApp +963 936 503 899 or visit us in Hama. We’ll review your situation and suggest a practical first step.
WhatsApp Nour Aldein TletiCall +971 58 996 9118WhatsApp Syria branch +963 936 503 899
Discuss your project with ONE DIGITAL