If two departments give you two different figures for the same balance, the problem is the data, not the report.
Data and reporting in financial institutions: from Excel to daily dashboards
Financial institutions collect large amounts of data, yet many rely on reports prepared by hand in Excel. Here we explain how an institution can build a reliable data foundation and reports that support timely decisions.
Banks and financial institutions 6 min read
By Nour Aldein Tleti. Updated .
How does a financial institution build a reliable data and reporting system?
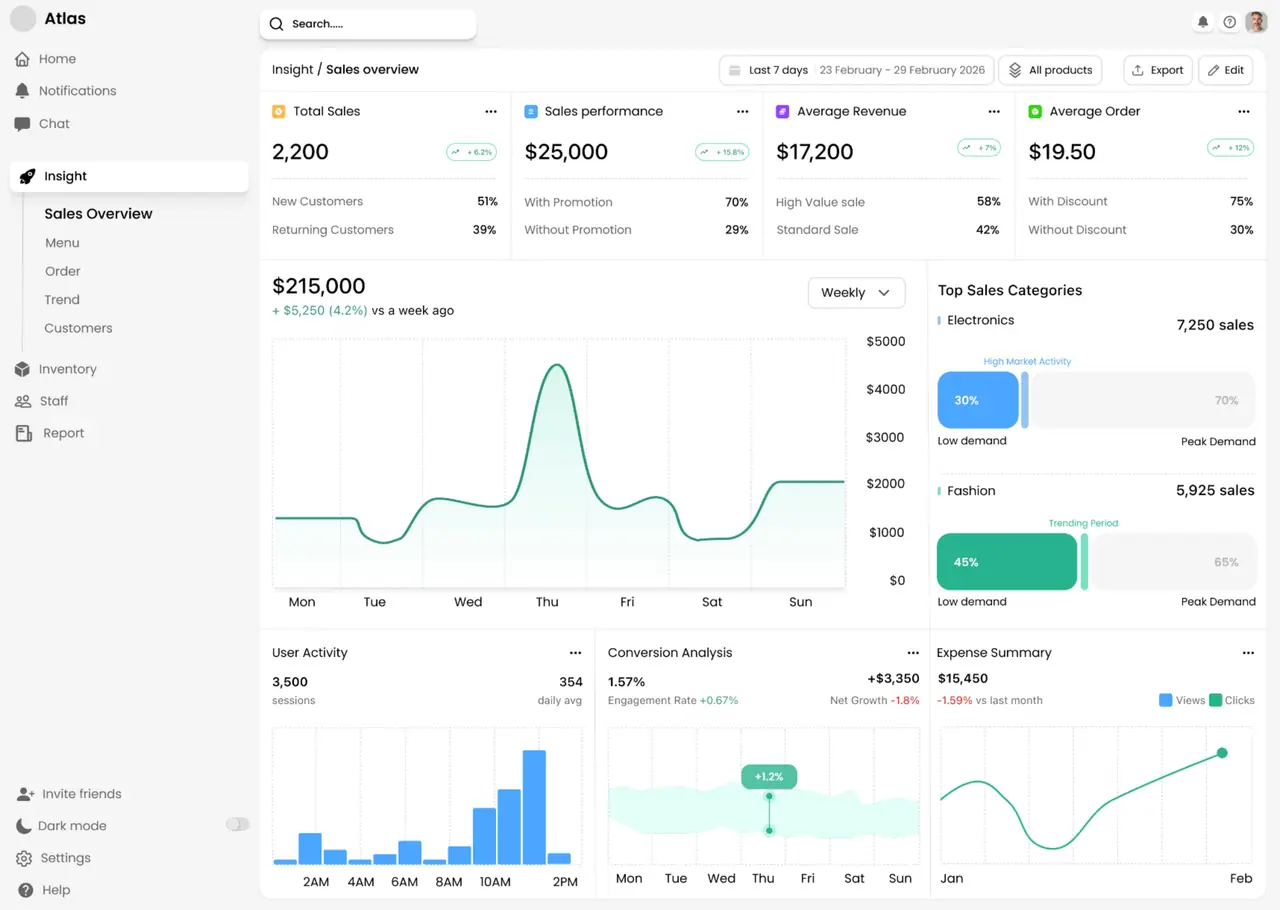
The institution starts by naming one approved source for each key figure, such as balances, loans and claims, and setting common definitions for its indicators. Data is then pulled automatically from systems into a reporting database, checked for quality, and shown in daily dashboards for management and ready-made reports for regulators. The result is consistent figures everyone trusts, less time spent compiling and more time spent analysing.
Financial data basics
- One source of truth
- Each figure has one approved source system, and manually edited Excel copies are not used as a reference.
- Common definitions
- A clear, written meaning for each indicator, such as “overdue loan” or “active customer”, that everyone uses.
- Data quality
- Automatic checks for missing fields, duplicates and unreasonable values before data enters reports.
- Permissions
- Each user sees only what they need, with special protection for customers’ personal data.
Types of reports
- Regulatory reports
- Periodic reports regulators require in set formats; check their requirements in force and automate their preparation as far as possible.
- Management reports
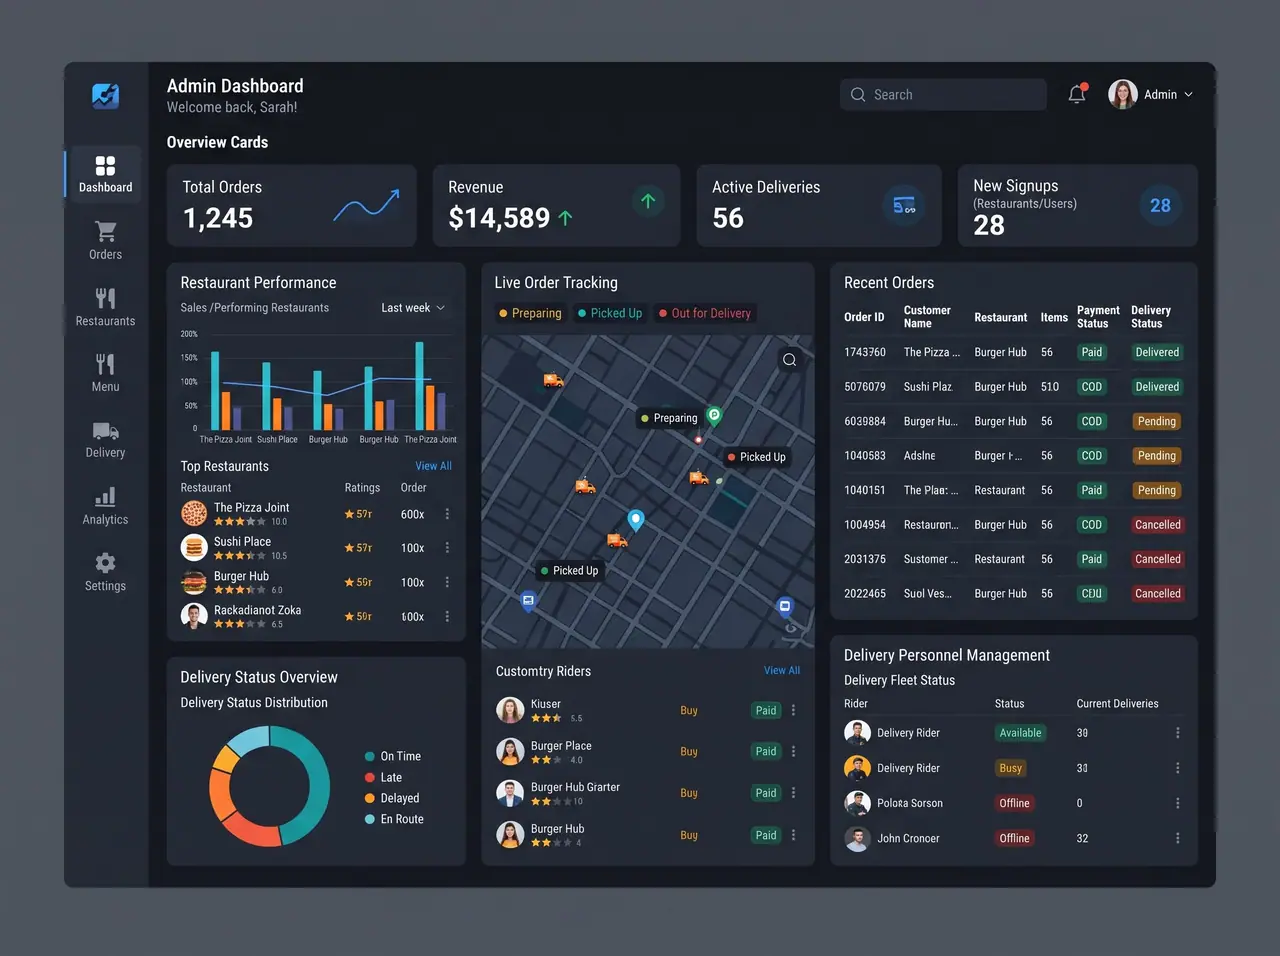
- Daily dashboards of balances, liquidity, portfolio quality and claims that help management act early.
- Branch and staff reports
- Each branch’s and employee’s performance against clear targets, with drill-down to a single transaction.
- Risk reports
- Concentration of exposure by sector, customer or currency, plus fraud alerts and unusual transactions.
Local challenges in financial reporting
- Two currencies and changing rates
- Each amount must be stored in its original currency with the exchange rate at the time of the transaction, and reports shown in both currencies or in a clear reference currency.
- Scattered systems
- Data in an old core system, more in Excel and more in a field app needs connecting before any unified report.
- Delayed updates
- When connections between branches drop, the report should show the last update time for each source.
- The Excel habit
- Staff are used to editing spreadsheets themselves, so moving to unified dashboards needs an explanation of the benefits, while keeping export available for further analysis.
Steps to build the reporting system
- 01
List current reports
Collect every report prepared today, who prepares it, where its data comes from and how long it takes.
- 02
Standardise definitions
Agree with departments on the definition of each key indicator, and document it in a data dictionary.
- 03
Automate data extraction
Connect systems to a reporting database that updates automatically instead of manual exports.
- 04
Build the first dashboards
Start with one dashboard for senior management with the most important indicators, then expand.
- 05
Review and improve
Review the accuracy of figures with departments monthly, and add reports as actual needs arise.
Manual vs automated reports
| Criterion | Manual in Excel | Automated from one source |
|---|---|---|
| Time | Long hours compiling and checking | Automatic daily or real-time updates |
| Consistency | Different figures depending on who prepared the report | One approved figure for everyone |
| Errors | Copy-paste and formulas that break | Automatic quality checks before display |
| Audit | Hard to trace where a figure came from | Possible to trace back to the original transaction |
| Access and protection | Files sent by email or WhatsApp | Dashboards with permissions per user |
Read also
Banks and financial institutions
Frequently asked questions
Do we need a huge data warehouse?
Not at the start. An organised reporting database updated automatically from the core systems is enough for many institutions, and it can be expanded later.
How do we present reports when exchange rates change?
Store amounts in their original currency with the historical exchange rate, then show the report in the original currency or a reference currency, stating the rate used and its date.
Can AI be used in financial reporting?
It can be used to detect unusual patterns or summarise reports, but only after reliable data is in place. AI on inaccurate data gives inaccurate results with more confidence.
Who owns the data inside the institution?
Each data set has an owner from the relevant department who is responsible for its accuracy, while the technology team looks after systems and protection.
Does ONE DIGITAL build financial reporting dashboards?
Yes. We build reporting dashboards and data systems with expertise that combines software development with financial and accounting systems.
Keep exploring
- Digital transformation for banks and financial institutions in SyriaIn finance, every digital feature faces one test: would I trust it with my money?
- Business intelligence and management dashboards in SyriaA manager who waits for reports manages last month’s business.
- Data and artificial intelligence for Syrian organisationsAI is only as useful as the data and rules behind it.
- Accounting in Syrian Pounds and Dollars: Setting It Up in Your SystemWhen the exchange rate moves, margins disappear in manual spreadsheets.
Need help with your organisation’s digital transformation?
Message ONE DIGITAL’s Syria branch on WhatsApp +963 936 503 899 or visit us in Hama. We’ll review your situation and suggest a practical first step.
WhatsApp Nour Aldein TletiCall +971 58 996 9118WhatsApp Syria branch +963 936 503 899
Discuss your project with ONE DIGITAL